

RESEARCH NOTES

HOW TO ANALYSE YOUR RESEARCH DATA? ILLUSTRATIONS WITH HANDS-ON EXERCISES USING SPSS.
Pearson’s correlation
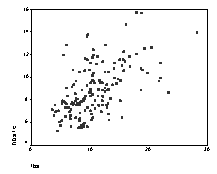
If you want to find out if there is a linear relationship between the HbA1c and fasting blood glucose (FBS) in these diabetic patients, then the appropriate statistical test is Pearson’s correlation, its value is denoted by “r” (Figure 1):
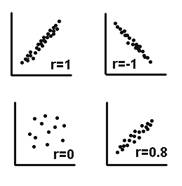
- Correlation value (r) is between 0 (no relationship whatsoever) to 1 (perfect straight line relationship).
- Correlation value (r) can be positive or negative depending on the direction of the relationship (e.g. one variable increases while the other decreases will have a negative correlation).
- In our analysis of HbA1c and FBS, we obtained r=0.539, p<0.001. There is a moderate amount of linear correlation which is significant as the P value is smaller than 0.05
The SPSS commands for obtaining the above Pearson correlation statistics are as follows:
From the menus choose:
- Analyze
- Correlate
- Bivariate
- Select ‘hba1c’ and ‘fbs’ into the ‘Variables’
- Click ‘OK’
Figure 1. Scatterplots
Figure 1A. (A) HbA1c vs FBS, Figure 1B. Examples of scatterplots
Word of caution and further analysis
- Parametric tests should not be used if (1) the dependent variable does not follow a normal distribution, (2) the variance (square of SD) of dependent variables in the subgroups are very different from each other i.e. if the variances of HbA1c among Malay, Chinese, and Indian in the above example vary significantly, (3) the values of dependent variable in one subgroup is affecting the value of dependent variable in the other subgroup i.e. if the HbA1c of one ethnic group is affecting another group which seems to be unlikely in the above example. There are statistical methods for assessing if these assumptions for parametric test are violated. Parametric tests are considered robust test, i.e. minor deviation from the assumptions does not aversely affect the validity of the statistical test.
- In the case of the above ANOVA, if you want to tease out the difference further (say between Malays vs Chinese, or Chinese vs Indians), then you will need further statistical analysis, e.g. post-hoc multiple comparisons (Bonferroni method).
- Paired t-test should be used if you have two sets of data for the dependent variable that are linked , e.g. HbA1c for these 160 patients is measured twice (before and after diabetic education).
- Multiple regression is needed if you want to determine how one dependent variable (must be a continuous variable, e.g. HbA1c) can be predicted by a combination of several independent variables (all must be continuous variables, e.g. BMI, FBS, age, etc).
INFERENTIAL STATISTICS: NON-PARAMETRIC TESTS
Let us say, you have decided to regroup your HbA1c data into three categories: optimal (<7.0%), fair (7-9%), poor (>9%). The summarised data is shown in Table 2.
Table 2: Proportion of HbA1c categories by gender and ethnicity
| Characteristics | HbA1c Optimal |
Fair | Poor |
| Gender | |||
| Male [n=71] | 11 (15.5) | 32 (45.1) | 28 (39.4) |
| Female [n=89] | 18 (20.2) | 34 (38.2) | 37 (41.6) |
| Ethnic group | |||
| Malays [n=45] | 6 (13.3) | 17 (37.8) | 22 (48.9) |
| Chinese [n=66] | 14 (21.2) | 28 (42.4) | 24 (36.4) |
| Indians [n=49] | 9 (18.4) | 21 (42.9) | 19 (38.8) |
| All patients | 29 (18.1) | 66 (41.3) | 65 (40.6) |
Note: The above results are percentages and the numbers in parenthesis are the standard deviations.